Royal Canin3 oz
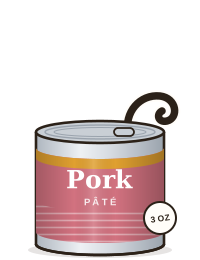
Kitten Loaf in Sauce
- Carbs
- 8.8%
- Protein
- 53%
- Phosphorus
- not listed
Low carbHigh protein
20 cans compared
The typical Wellness can gets 6.2% of its calories from carbohydrate, against 14.6% for Royal Canin. Royal Canin has 2 of 10 recipes under the 10% low-carb line; Wellness has 7 of 10. Below, every number is worked out the same way from each can’s label.
Typical values are the middle recipe of each brand. Shares are of calories, so textures compare fairly. Marked cells show the better value where the gap is meaningful.
| Royal Canin | Wellness | |
|---|---|---|
| Cans we compare | 10 | 10 |
| Typical carbs, % of calories | 14.6% | 6.2% |
| Carb range | 8.8–24.1% | 0–25.9% |
| Recipes under 10% carbs | 2 of 10 | 7 of 10 |
| Typical protein, % of calories | 53% | 40% |
| Typical fat, % of calories | 29% | 51% |
| Calories per ounce | 22 | 27 |
| Calories per can | 55–78 | 66–481 |
| Recipes with published phosphorus | 0 of 10 | 8 of 10 |
| Typical phosphorus, mg per 100 kcal | — | 168 mg |
| Confirmed for kittens | 2 of 10 | 3 of 10 |
| Chicken-free recipes | 0 of 10 | 2 of 10 |
| Fish-free recipes | 2 of 10 | 1 of 10 |
| Textures | Pâté, Chunks in gravy | Pâté, Flaked, Shreds in broth, Chunks in gravy, Minced |
The recipe with the smallest share of calories from carbohydrate on each side, leaving out toppers meant for supplemental feeding.
Put these two side by side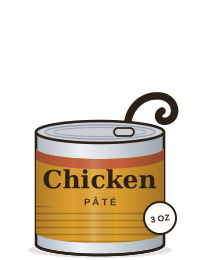
For each texture both brands make, the lowest-carb recipe from each.
| Texture | Royal Canin | Wellness |
|---|---|---|
| Pâté | Kitten Loaf in Sauce8.8% carbs · 53% protein · 78 kcal | Chicken, Turkey & Chicken Liver Recipe0% carbs · 40% protein · 116 kcal |
| Chunks in gravy | Adult Instinctive Thin Slices in Gravy10.6% carbs · 62% protein · 66 kcal | Chicken Entrée Cubes in Rich Gravy6.9% carbs · 37% protein · 79 kcal |
Wellness is the lower-carb line overall. Its lowest-carb recipe is Chicken, Turkey & Chicken Liver Recipe at 0% of calories; Royal Canin’s is Kitten Loaf in Sauce at 8.8%. Both brands have recipes under the 10% line (7 of 10 against 2 of 10), so the right recipe matters more than the brand.
Royal Canin doesn’t publish phosphorus on the pages we checked. Wellness publishes phosphorus for 8 of 10 recipes (typical 168 mg per 100 kcal). Only recipes with a published value can be checked, so start from those and confirm targets with your vet.
Royal Canin has 2 of 10 recipes whose label we could confirm covers growth or all life stages; Wellness has 3 of 10. A missing statement doesn’t mean a can is unsuitable, only that we couldn’t verify it.
Chicken-free: Royal Canin 0 of 10, Wellness 2 of 10. Fish-free: Royal Canin 2 of 10, Wellness 1 of 10. Textures: Royal Canin makes pâté, chunks in gravy; Wellness makes pâté, flaked, shreds in broth, chunks in gravy, minced.
The typical Wellness can gets 6.2% of its calories from carbohydrate, against 14.6% for Royal Canin. Royal Canin has 2 of 10 recipes under the 10% low-carb line; Wellness has 7 of 10.
Wellness. Its typical can gets 40% of calories from protein, against 53% for Royal Canin. Royal Canin has 8 of 10 recipes over 50% protein calories; Wellness has 2 of 10.
Royal Canin. Its cans average 22 calories per ounce against 27 for Wellness, so a cat needs fewer ounces of it to get the same calories.
Royal Canin doesn’t publish phosphorus on the pages we checked. Wellness publishes phosphorus for 8 of 10 recipes (typical 168 mg per 100 kcal).
Carbs are what matter most, and Wellness has the lower-carb line with 7 of 10 recipes under 10%. The best single choice is a specific recipe, not a brand: Kitten Loaf in Sauce (8.8%) from Royal Canin or Chicken, Turkey & Chicken Liver Recipe (0%) from Wellness. Change a diabetic cat’s food only with your vet.